
Prometheus
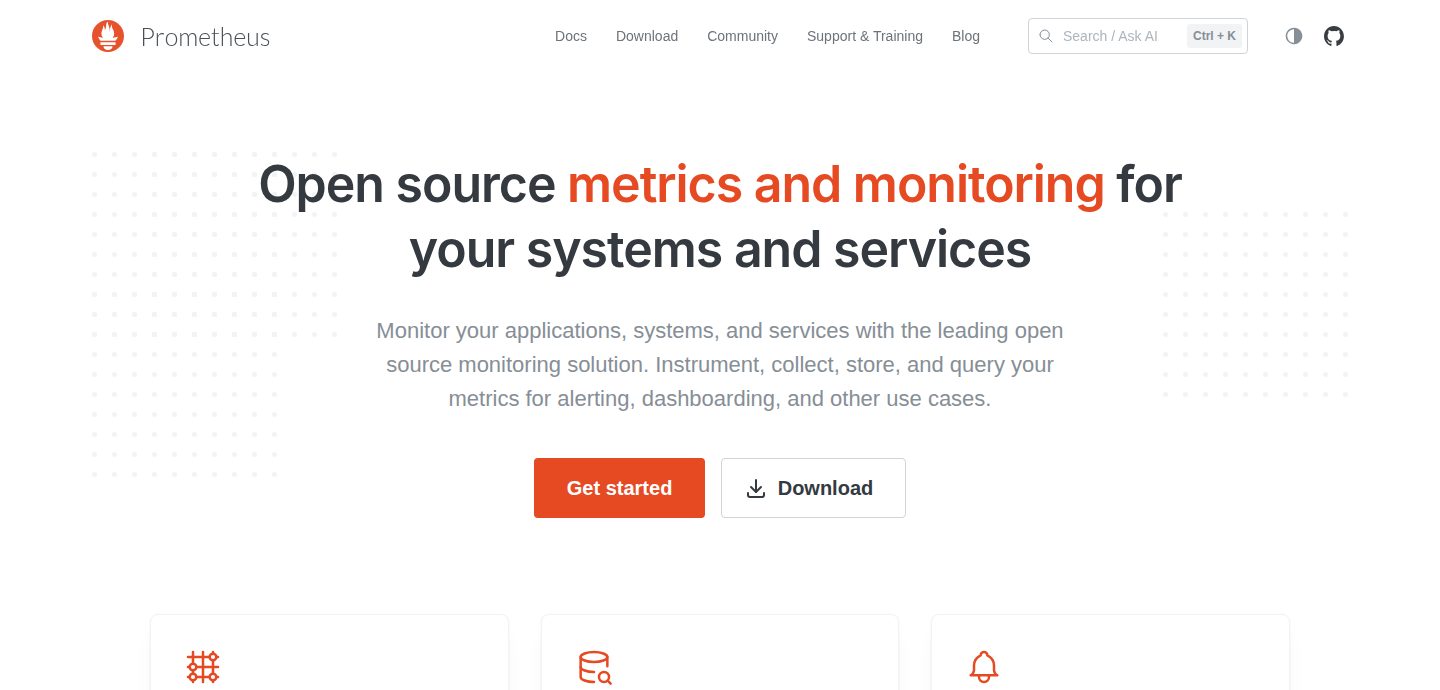
MonitoringA metrics monitoring and alerting system that stores time series locally and is queried with PromQL; a CNCF graduated project.
What the free edition leaves out
We have not been able to confirm enough from official sources to give a verdict. “Not confirmed” means the official pages we read did not say, so we do not guess.
| Feature | Free edition | Details | Source |
|---|---|---|---|
| SSO / SAML | Not confirmed | The security docs describe TLS client certificates and basic auth, and do not mention SSO. | Source ↗ |
| Role-based access control | Not confirmed | The security docs do not describe users or roles. | Source ↗ |
| Audit logs | Not confirmed | The security docs do not discuss audit logging. | Source ↗ |
| Multi-user / teams | Not confirmed | No user accounts are described in the docs read. | Source ↗ |
| Backups and restore | Free | The storage docs recommend snapshots for backups; a restore procedure is not described. | Source ↗ |
| API access | Free | The API docs say the stable HTTP API is reachable under /api/v1 on a Prometheus server. | Source ↗ |
| Support SLA | Not confirmed | The homepage links a Support and Training page that was not read. | Source ↗ |
Best for
Teams that want to collect and alert on metrics from servers and services on their own infrastructure.
Why choose it over New Relic
Apache-2.0 licensed with no paid edition described on the project site, and it runs as a single Go binary on local storage. PromQL lets you query and combine labeled time series, and alerting rules use the same language.
Where it falls short
The storage docs say local storage is not clustered or replicated, so one server is limited to one node's scale and durability. The site describes it as a metrics system, so logs and traces need other tools. Anyone who can reach the Alertmanager endpoint can see its data.
Open-source alternative to
- New Relic — Prometheus can replace New Relic's metrics monitoring and alerting for teams that self-manage their stack.
- Datadog — Prometheus can replace Datadog's metrics collection, querying and alerting when you run it yourself, but it does not cover logs, traces or a hosted UI.
Category
MonitoringTopics
Tech stack
 Go
Go TypeScript
 Docker
Languages as reported by GitHub for the repository.


